Specialized expertise in computer vision applied to financial data extraction and analysis
Financial Services & Insurance
Transforming visual financial data into actionable intelligence
A fintech company supporting investment analysts and portfolio managers who rely on technical chart analysis to inform trading decisions—at a volume and speed that manual interpretation could not sustain.
The challenge
The analytical workflow was fundamentally constrained by the limitations of manual chart interpretation:
- Analysts manually interpreting hundreds of stock charts daily, creating severe throughput bottlenecks
- Visual data locked in image formats, impossible to query, aggregate, or compare systematically
- Inconsistent extraction of technical indicators introducing analytical variance across teams
- Research workflows unable to scale as data volumes grew faster than analyst capacity
- Time pressure in fast-moving markets making slow manual analysis a direct competitive disadvantage
The solution
JBS built a computer vision for financial data solution enabling:
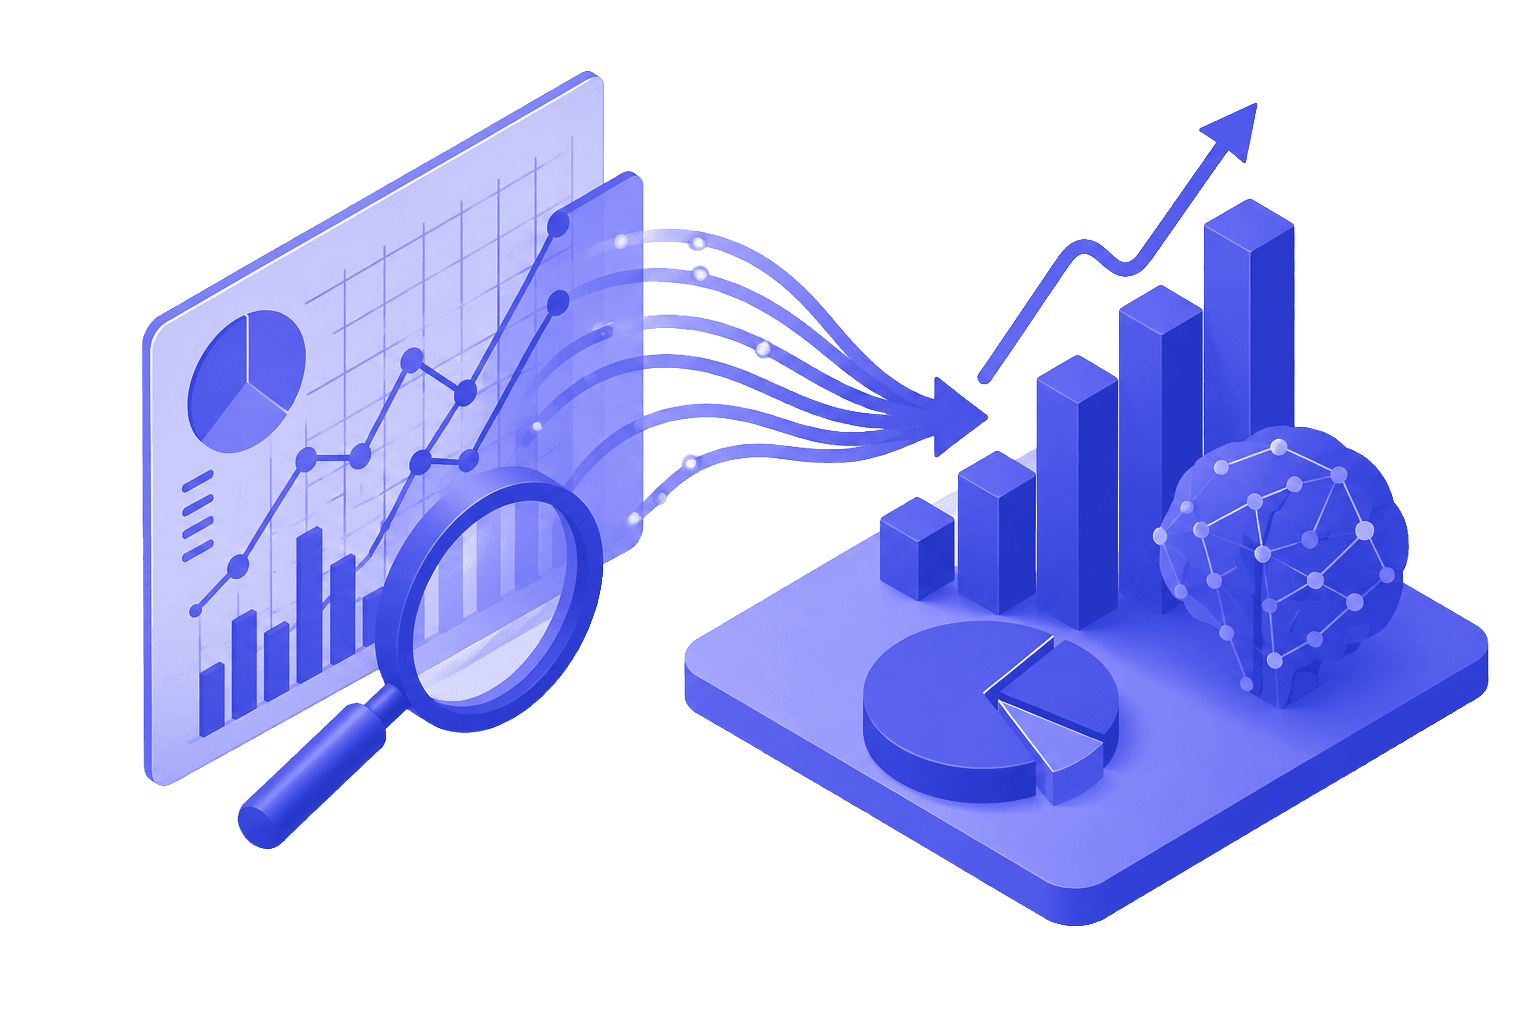
- Computer vision pipeline trained to extract key technical indicators from stock charts and visual data
- Automated conversion of chart images into structured, queryable datasets ready for downstream analysis
- Consistent methodology applied across all processed charts, eliminating inter-analyst variance
- Batch processing capability enabling simultaneous analysis across large instrument universes
- Integration layer connecting processed chart data directly with existing investment workflow tools
The business impact
- Analysts able to cover significantly more instruments per session without sacrificing quality
- Technical indicator data made consistently extractable and comparable across all processed charts
- Research cycle times shortened, enabling faster response to market movements and opportunities
- Data quality and consistency improved substantially over previous manual extraction approaches
- Analytical capacity scaled to match data volume without linear headcount growth
Results achieved
- Chart interpretation capacity multiplied versus manual analyst-led approaches
- Technical indicator extraction standardized and accelerated across large instrument universes
- Research-to-insight cycle times reduced substantially, improving competitive positioning
Why JBS
Experience deploying AI in high-accuracy, high-stakes analytical environments
Integration capability connecting AI outputs directly into existing financial workflows
Outcome-focused delivery ensuring AI performance meets financial-grade accuracy standards
Financial Services & Insurance AI capability at enterprise scale
JBS approaches this use case as a production-grade operating capability, aligning AI engineering, workflow design, governance, and measurable business outcomes.
How the solution works
The solution combines domain context, automation, quality review, and integration into operational workflows so teams can move faster without losing control.
Frequently asked questions
What is computer vision for financial data?
Computer vision for financial data is the use of AI image models to read charts, statements, and other visual financial information and convert it into structured, queryable data. JBS applied it to extract technical indicators from stock charts, turning images analysts once read manually into datasets ready for analysis.